This paper discusses the impact of item-level RFID in inventory accuracy. A simple mathematical approach for simulating the effects is used to determine accuracy. The results are shown visually as well as in numeric data.
INVENTORY ACCURACY DETERIORATION
Understanding inventory accuracy deterioration is a starting point for evaluating the impacts of RFID counts. The best way to find out how accuracy deteriorates would be to use real measurements and tests. Also, in most real-life cases responsible persons in stores can give good estimates and explanations based on experience. For generic analysis, a mathematical model is useful, with a mathematical model it is easy to analyze the effects of various parameters on the end result.
INVENTORY ACCURACY DETERIORATION – MODEL AND EXAMPLE
As an example, we use a store that has 1000 items in 1000 locations. An item file describes where each item is. In this item file, there are 1000 data points, each of them is either correct or incorrect.
In the store may occur five different types of incidents that deteriorate the item file accuracy. These incidents have different probabilities of occurrence, i.e. they occur at various intervals. The incidents occur for a population of 1000 items as follows:
- A: 3 times per 1 day
- B: 2 times per 1 day
- C: 1 time per 1 day
- D: 1 time per 2 days
- E: 1 time per 3 days
At the beginning (day 0) the item file has 1000 correct lines. Based on the occurrence rates above there are 3+2+1+0.5+0.3 incidents = 6.8 incidents during the first day. After the first day, the item file has 993.2 correct points and 6.8 incorrect ones.
In the example, only incidents deteriorating the inventory accuracy are being used. This model also includes a possibility to model incidents that improve accuracy – such as store personnel placing misplaced items in their correct place, and incidents affecting both ways – such as a customer placing items randomly on the shop floor. To understand and analyze the item file accuracy development on a generic level, it is better to focus on some clear incident types.
The model used in this paper is a simple excel chart, that is used for calculating item file accuracy based on the parameters described above after each day. For simplicity, only the accuracy at the end of each day is calculated, as if all incidents would occur at a single point in time; at the end of each day. In the model also the item quantity is static – all items sold are replaced with the same items during the day. In the model incidents and developments happening during the day are not factored in.
BASELINE – 100% ACCURATE INVENTORY COUNT ANNUALLY
With the model and parameters described above, the item file deteriorates as described in the graph below.
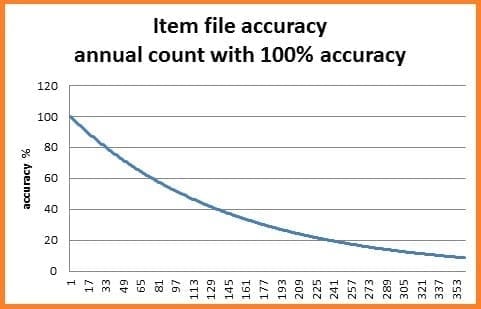
Picture 1: Item file accuracy over a 360 day period without inventory counts.
For over a one-year period the average accuracy with these parameters is 37.1 %.
As we can see, the item file accuracy deteriorates faster, when the file is correct. Over a long time period, the asymptotically approaches zero (0).
QUARTERLY 100% ACCURATE INVENTORY COUNTS
When inventory counts are made quarterly with 100% accuracy, the item file starts deteriorating after each count, and in the count returns to 100% accuracy. The result is shown in a picture below.
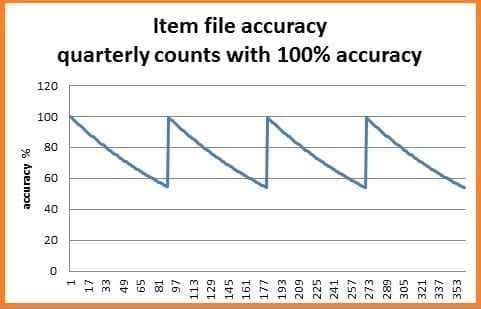
Picture 2: Inventory accuracy with quarterly counts.
In this case, average annual accuracy is 73.5%.
FULL WEEKLY RFID COUNT WITH 97% ACCURACY
In the first RFID based scenario counts are done weekly and the accuracy of the count is 97%. Results are described in a graph below.
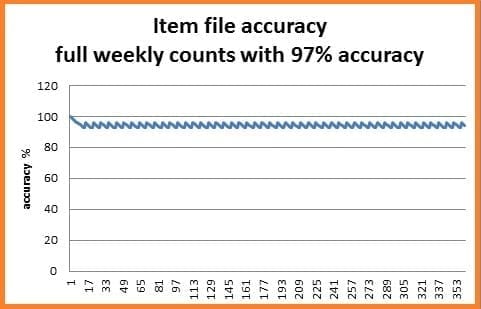
Picture 3: Inventory accuracy with weekly full counts using RFID.
In this case annual average accuracy is 94.5%.
From the graph the deterioration and correction of the accuracy level upto 97% can be seen. In this case the first count actually decreases item file accuracy since in a week it has not deteriorated to 97%.
10% OF ITEMS ARE COUNTED DAILY WITH 93% ACCURACY
The second RFID based scenario is to use more frequent partial counts. In this case item file accuracy reaches a minimum level. For example, if 10% of the items are counted daily with 93% accuracy the results are as shown in the graph below.
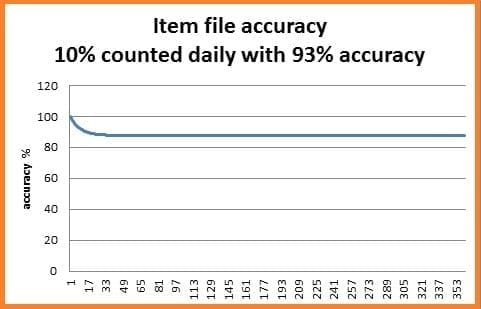
Picture 4: Inventory accuracy with daily partial RFID counts
The average annual accuracy is 87.9% and over a long period of time the accuracy settles to 87.6%.
COMBINATION OF PARTIAL DAILY RFID COUNTS AND MONTHLY FULL RFID COUNTS
The third RFID based scenario analysis combines partial and full counts. In the example, 10% of the items are counted daily with 93% accuracy and a full count with 97% accuracy is performed monthly. The results are shown in the graph below.
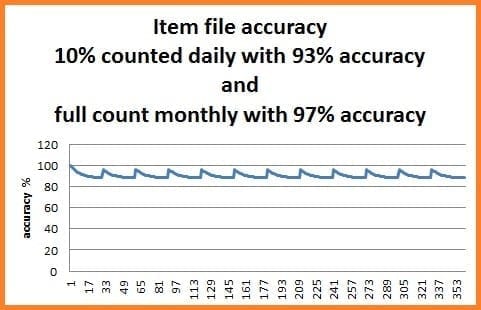
Picture 5: Inventory accuracy when partial daily counts and monthly full counts are combined.
In this scenario, the average annual inventory accuracy is 90.2%.
CONCLUSIONS
A mathematical model is a useful tool for evaluating and visualizing item file accuracy with various RFID based count scenarios – it can be used as a simple way to evaluate the effect of RFID count accuracy and RFID count frequency.
Item level RFID enables frequent counts and thus the inventory accuracy improves. In the example case, the average annual inventory accuracy is
- 1% with the annual count
- 5% with quarterly counts
- 5% with weekly full counts with 97% accuracy
- 9% with daily 10% partial counts with 93% accuracy
- 2% with combining 10% partial daily counts with 93% accuracy with 97% accurate monthly full count
Using item-level RFID has clear benefits in the example case. Both full periodical counts and frequent partial counts are usable. Also, a mixed model is feasible. The selection between these models can be based on other store processes. It is good to keep in mind that inventory accuracy simulations are impacted by the parameters used, such as various RFID count intervals and accuracies, various deterioration parameters, and various starting positions.
Inventory accuracy is also impacted by the environment where the read takes place. If you are interested in how to avoid dead spots and optimized reading, learn more in our expert article Avoiding dead spots and optimizing near field UHF RFID reading.